
Emotional Map
Role: Personal Project: User Research + Computer Graphics + Animation
Tools: Rhino / Unity / Sketch / P5JS / After Effect / Adobe Illustrator / HTML / CSS
Time: 10/01 2020 — 11/16 2020
This project explores the emotional relationship between people and the map. It allows users to interact with maps effectively. I break the limitation that a map can only show the spatial information. Multi-dimensional elements such as real-time emotion, the flow of population, and temperature are going on.

Thoughts&Insights
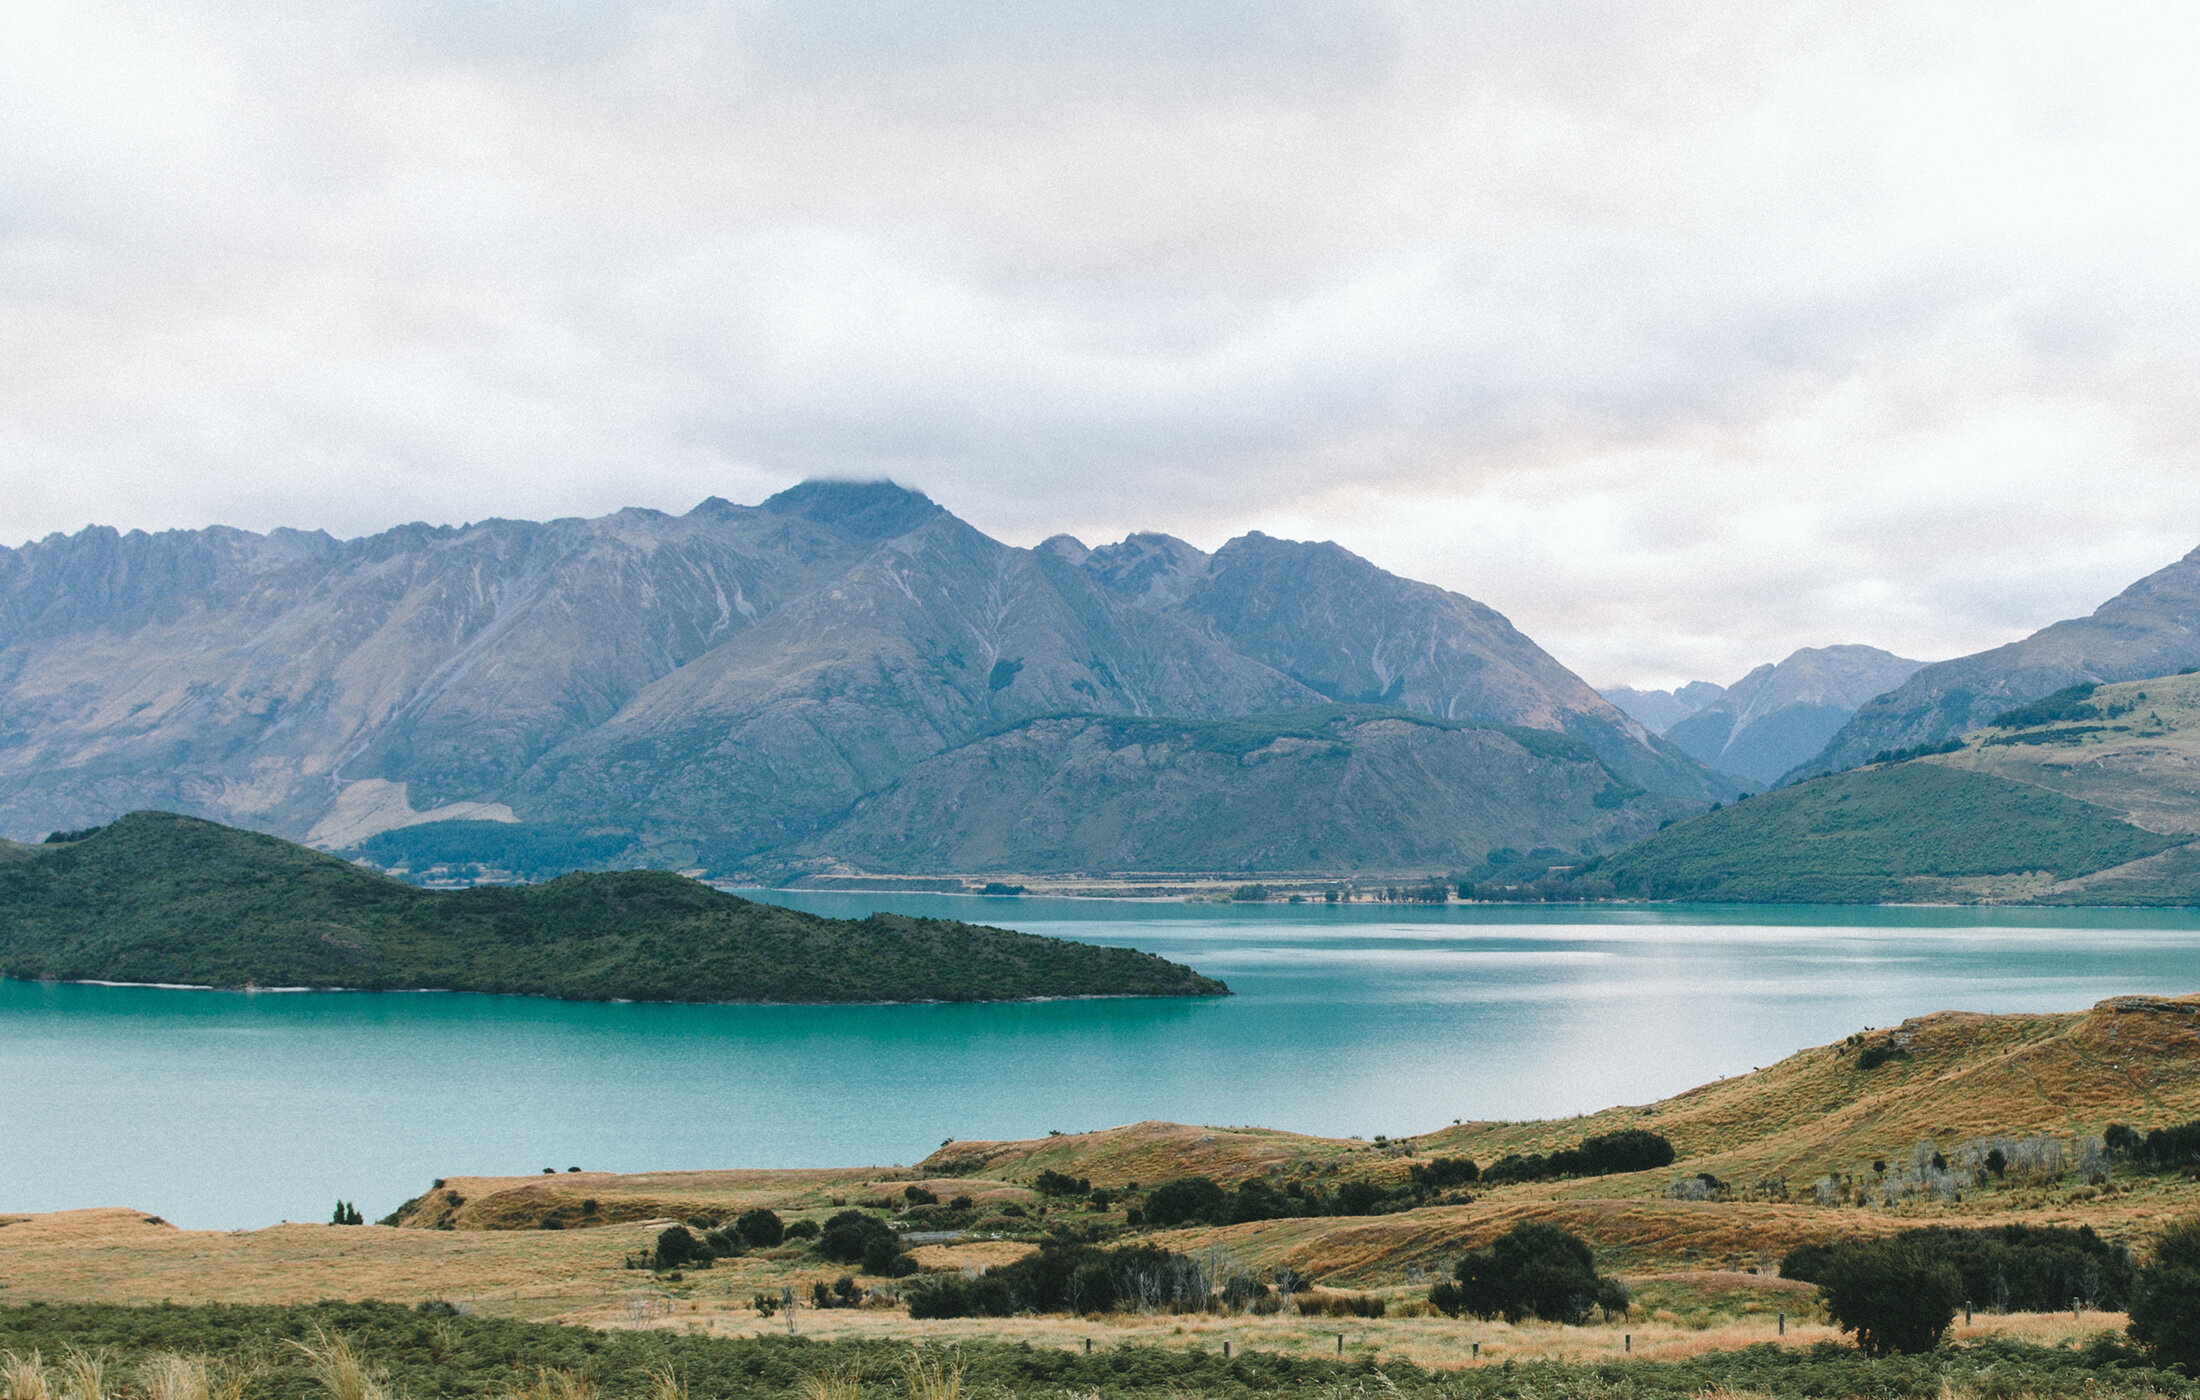
In my internship at Tencent, I did work related to navigation.
In the process, I found that people's understanding and cognition of maps, places, and navigation were limited to the latitude and longitude of buildings. The interpretation of the map from both static and objective levels is limited.
The soul of a city is composed of the accumulation of some buildings and the communication between people, light, color, sound, etc.
Process
User Research
Define
Concept Explore
Development
Wireframe&Programming
Initial Prototype
User Testing
Iterations
User Research
To find out the connection between an area and a person’s emotional status. Also, what kind of factors in this area affect their emotion? I conduct two types of user research.
Push 1 Observation
I randomly took pictures of 30 pedestrians in four different places and one of the four at different times. I used a form to record information about them.
The goal of the observation is to see the real-time information that people can show in different types of areas.
Key findings
Two areas carried same facilities
They have different atmospheres
They can attract different types of people
An area in different time
People are in different emotional states.
The pace of life is different.

Push 2 Focus Group
There are 3 groups of people of different ages that I interviewed. I asked them about four types of emotion. For example, Which area you think can immediately be associated with happiness? I asked them to talk about their personal experience
The goal of the focus group is to see how people define their own emotions related to areas.
Key findings
People have different memories of one area
Different understandings depend on their various characteristics and needs
A person’s impression of an area is not only related to the atmosphere of this area but also his personal experience

Challenge
People's life in a city includes places of various functions and their emotional dependence on a place. Most of today's maps are more functional and fail to provide users with destination search and diversified exploration from an emotional perspective.
Solution
I want to design a platform that can not only bring location information but also meet the emotional needs of users.
Based on the key findings of the user research, I found out that the feeling of an area that a person has is not limited in longitude and latitude. This map will show the creativeness and break through the concept of itself.
01 Personalization
People who use the map always couldn’t find a place that satisfies their emotional requirements.
02 Diversified
The map is not only showing the longitude and latitude but also the light of the street. It gives the area a creative appearance.
03 Visualization
Users can see the change in people’s emotions, temperature, and any other factors that are in a specific place visually. The visual elements are flowing and dynamic.

Concept
This map will be designed with four basic factors. Those are the things that may affect a multi-dimensional map.

Development
This map will be designed with four basic factors. Those are the things that may affect a multi-dimensional map.

Wireframe&Programming
Initial Prototype
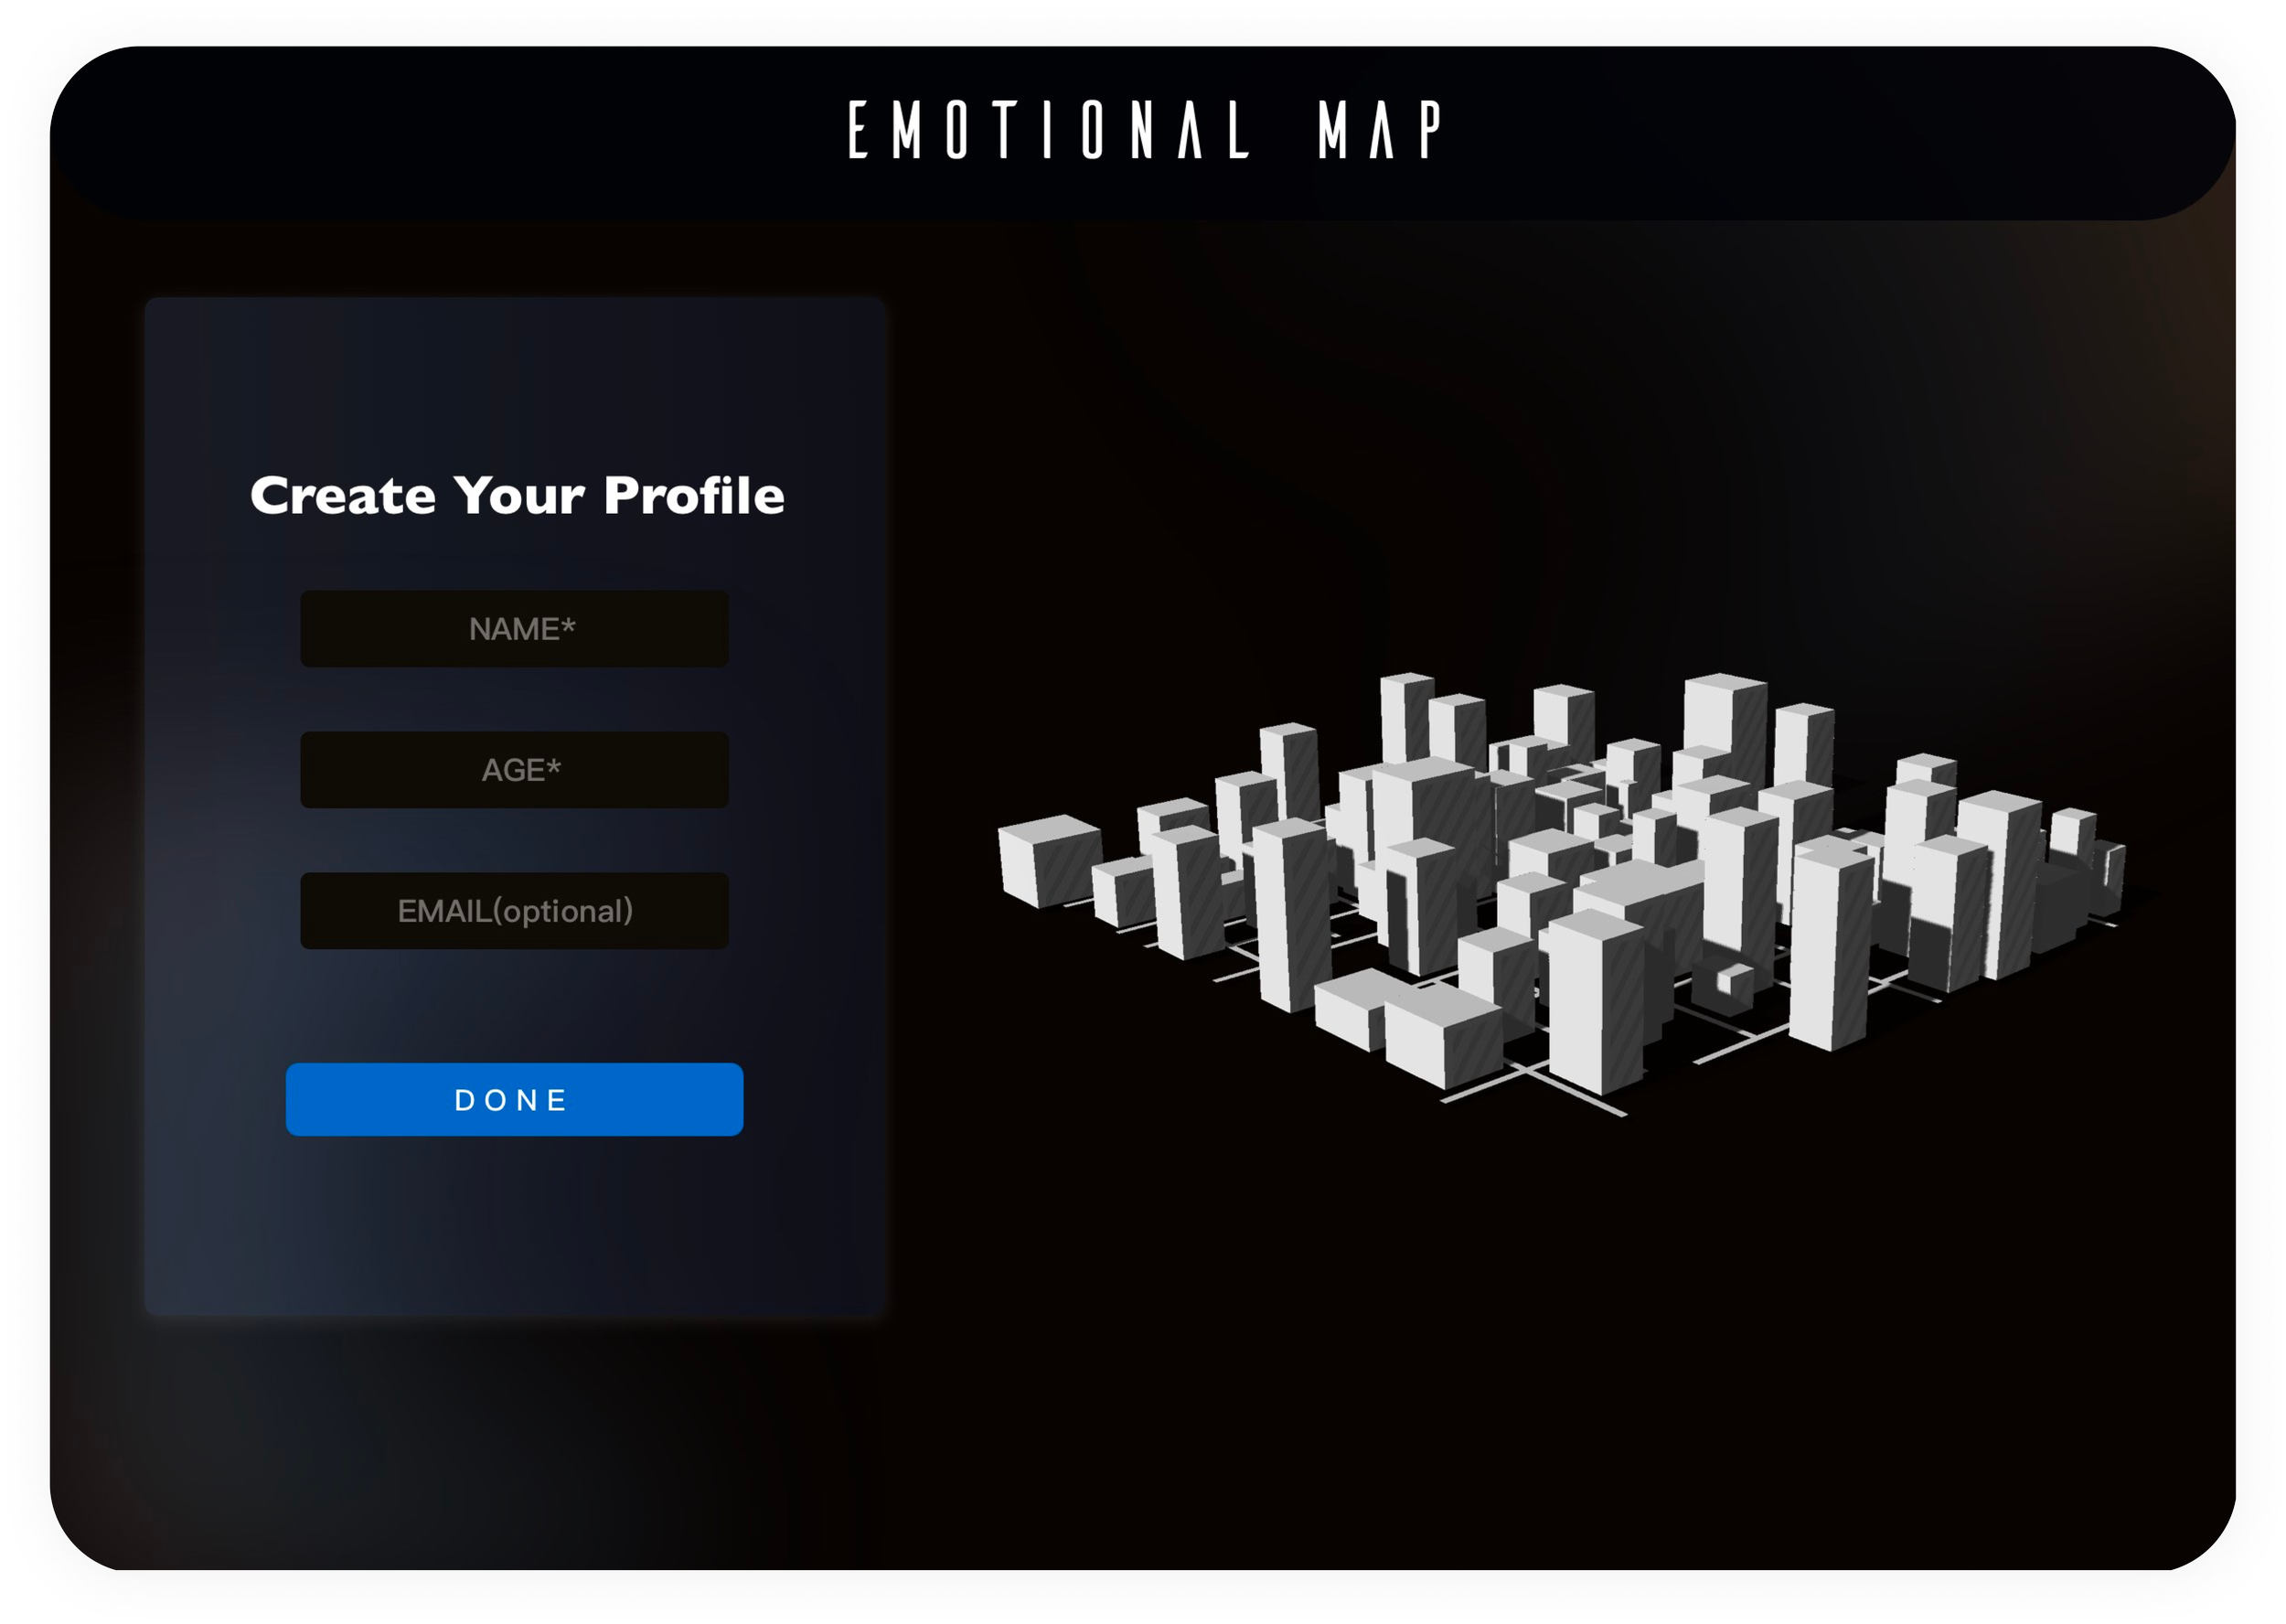
Product Features & User Feedback
I found six people to play around with the initial prototype and provide feedback on what they like and don't like.


#1. Personalization
Create a profile, Help provide data for the map,


#2. Visualization
Details of an area Location — Temperature, Emotional Data Overview, Population number, Sound, Light.

#3. Dynamic Presentation
Use the flow of the lines and color to show the vibe of an area
When users first came into the app, they will see the default model in aerial view. This model is based on their current location,
USER FEEDBACK #1
4 / 6 Think this function brought them a feeling of freshness when they opened an app with the name 'map,' then they were confused about why they needed to log in. Most of them didn't want to input their contact info because they didn't like to get ads.
Instead of having the route info of a location, I used the form of data visualization to show people’s feeling in this area, temperature and volume, etc.
USER FEEDBACK #2
5 / 6 All of them love the new look of a map. They want to see the changes in an area in one day. One of them said: “ I know this is a special map, but I still want to see some basic info on a map to help me understand the function of this area.”
The lines on the model will flow with the movement of people, and the color will change according to the emotional proportion of the user in the place.
USER FEEDBACK #3
6 / 6 Think this is very interesting. They think it looks like this area is alive. Some of them said they definitely want to play around to see what is going on in different areas.
Iterations


Iteration #1
Users can only provide name and age. Email became optional.
Iteration #2
Based on users' feedback, they want to see the changes in a factor and the original feature of a map. Therefore, I added curve graphs and the actual photo of this area.
Iteration #3